Graph IDE ► Data Graphics
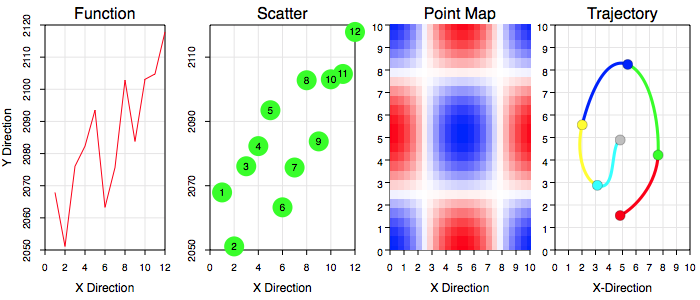
A data graphic is a graphic which is defined by points and has point-wise graphic representations. The following figures show examples of a data graphics in use.
The following is a brief list and definition of data graphics:
| Section | Description |
| Bar And Column Chart | A Bar And Column Chart is a sequence of rectangles whose length represent scalar values. The rectangle can also have an accompanying label. |
| Function | A function is a sequence of points whose x-values increase with sequence index. |
| Pie Chart | A Pie Chart is a sequence of circles whose wedge angles represent proportion of data. The wedge sections can also have an accompanying label. |
| Point Map | A Point Map is a regular grid of z-values. The z-values are represented by color. Each point can also have an angle in which case the Point Map represents a vector field on a regular grid. |
| Scatter | A scatter is a set of points either independent of each other, or relative to an origin which can be any point but can also be the mean of the data points. |
| Spreadsheet | A spreadsheet is a table with textual cell entries that are stored with the table. |
| Trajectory | A trajectory is a sequence of points connected by curves, each two consecutive points defines the end point of a Cubic Bezier section so that there are also two spline knot points between the points to form the spline, but are not considered part of the data proper. |