Graphics are organized by layers. The Graphic View has layers called Overlays. Graphs have four layers to hold data graphics and some graphical elements of a graph. Layers can also be encountered in other areas, which are left unspecified (implicit) at this time.
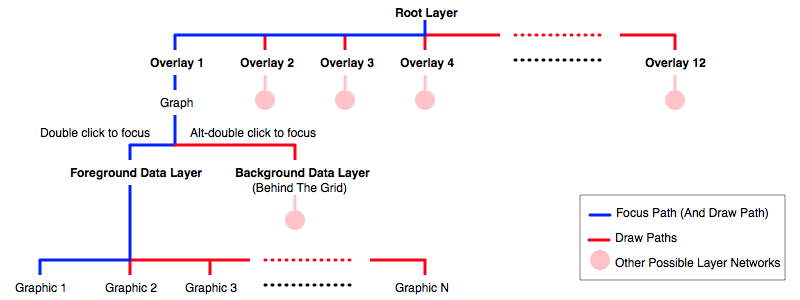
When you add a graphic to a Graphic View, in reality you are actually adding it to the focused layer which is contained in the Graphic View. The Graphic View maintains a tree structure network of such layers and Graph IDE's user interface helps navigate that network. The figure below shows a typical layer network where there is one graph on the focused layer path.
The section Getting Data On A Graph demonstrates how to navigate layers using mouse clicks. You can select and edit graphics in a single layer using Standard Editing controls. When graphics are selected in a layer using drag-select then the Layer inspector editor is loaded.
Layers can also be navigated using the Navigator which is a flattened and serialized representation of the tree structure of layers and embedded leaf nodes.