Graph IDE ► Composites ► Trends
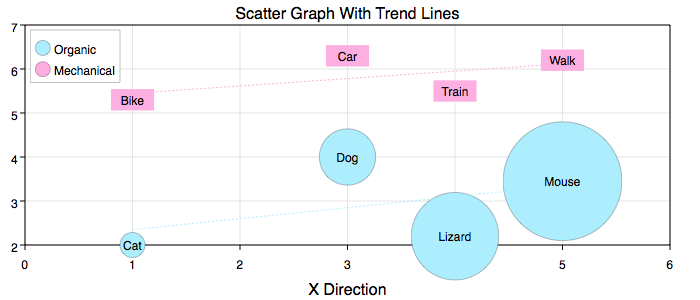
A trend is a fit to 2D data points. The fit is a 2D linear regression which shows as a dashed curve by default. The following figure shows the Legend example with a trend curve for each scatter graphic.
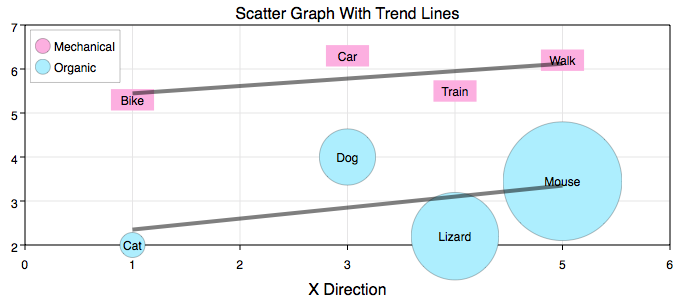
Because the default trend graphics are not bold enough for this particular graph, they are altered in the following figure. Noticed how the legend entries are reversed ordered as well. All the alterations were made using Standard Editing techniques.
To make trends follow these steps:
Trend curves instantiate as Function graphics. They are computed by least squares and are hence a line in a rectilinear coordinate system. However, that line maps to a curve in non-linear coordinates and hence the word curve instead of line when describing a trend.