Graph ► Tutorials ► Representations
As you learned in the Main Idea section the user interface is totally dedicated to one core concept which is "task representations". It is so important that this section describes the process of navigating to representations for two tasks.
Set Of 2D Points
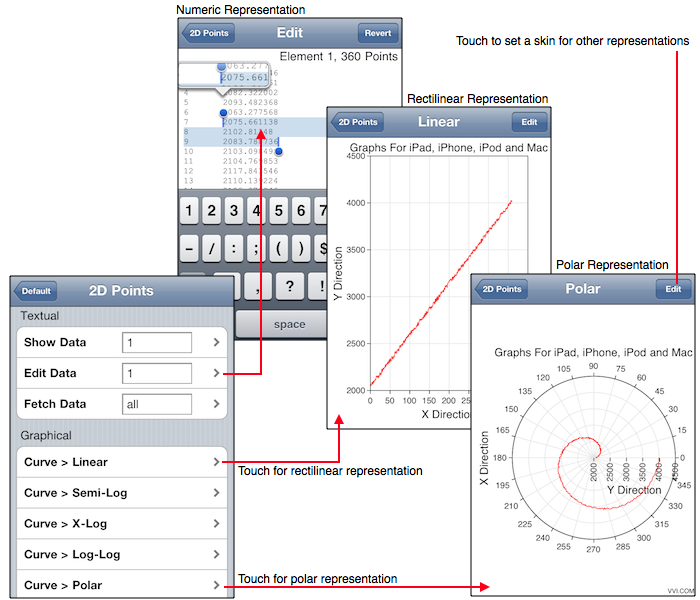
The following diagram shows some of the representations for the Set Of 2D Points task.

Essentially, once on the Home tool you navigate to a task, in this case the Set Of 2D Points task by selecting the "Set Of 2D Points" row on the home tool. Once on the Set Of 2D Points task page then, as you see in the diagram above, you then select a row for a given representation. Selecting the Edit Data row brings you to the textual representation of the data which in this case are 2D points. The textual representation are also used to edit the numeric data directly, as you can see by the diagram. If you, instead, select the "Curve > Linear" row then you navigate to a rectilinear line graph. If you select the "Curve > Polar" row then you navigate to a polar line graph. And so on and so on with all the rows on the task page, save the bottom grouping.
Z Values
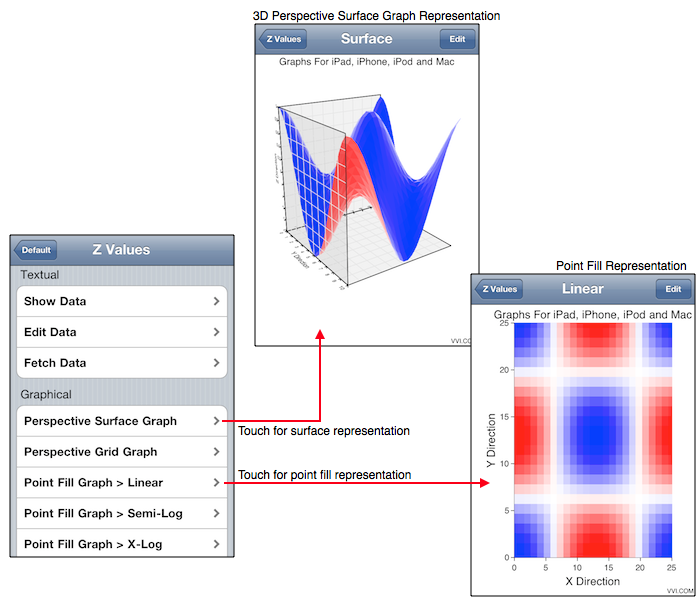
The following diagram shows some of the representations for the Z Values task.

Navigate to this task from the Home tool by selecting the "Z Values" row on the home tool. Once on the Z Values task page then, as you see in the diagram above, you then select a row for a given representation.
Conclusion
With a little experimentation and common sense one should be able to quickly enter data for a task and then navigate to the various representations of that task to see a desired result. The idea of a task is that it transforms the data to the representations. As such, the data needs to be entered only once and the various representations can be had by selecting a row of the task.