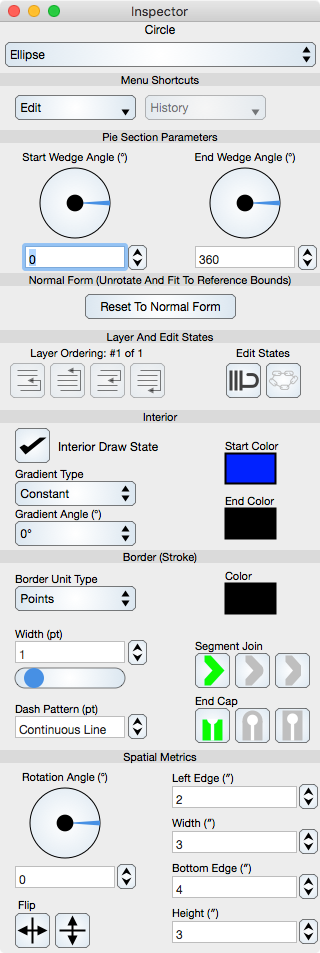
Menu Shortcuts
Edit : The Edit menu shortcut is one of Cut, Copy, Paste, Delete or Select All.
History : Shows the history of the graphic. For this to be enabled, history recording must be selected in the Graphic View tool inspector. Selecting a menu item makes that history recording the current state. On platforms that accept hover, hovering over a menu item will pan the history. The last menu item clears the history only for the focused graphic. All history can also be cleared in the Graphic View tool inspector.
Specific Controls
Controls specific to a graphic, in this instance the Pie Section and Normal Form controls, are defined in the respective sections; for example the Circle section. Those controls are typically at the top of the inspector editor controls and what follows are controls common to most graphics. This section only details common controls. For descriptions of specific controls consult the corresponding section in this manual.
Layer And Edit States
Layer Ordering : Controls the order of the focused graphic relative to other graphics in the same Layer. The buttons are: order up, forward, order down and bottom.
Edit States : The lock specifies whether the graphic can be altered by direct mouse interactions such as resize and move or deleted, and the link button defines whether the graphic's link status is shown. While locked, the graphic can not be deleted, moved or resized directly however it can be altered by explicit use of its inspector editor controls.
Interior
Interior Draw State : Select this to draw the interior of the graphic. This control can also be a button that can be one of No Fill, Solid Fill, E/O Fill. E/O means Even/Odd winding rule fill.
Gradient Type : Constant means a single-color fill, otherwise select one of the other options. See Effects for additional information.
Gradient Angle : Select one of the options for preset gradient angles. See Effects for additional information.
Start Color : Sets the start Color of the gradient. If the gradient is Constant then this is also the solid fill color of the interior of the graphic. See Effects for additional information.
End Color : Sets the end Color of the gradient. If the gradient is Constant then this is unused. See Effects for additional information.
Border (Stroke)
Border Unit Type : Select one of None, Points or Indigenous. None means do not draw the border.
Color : Sets the Color of the stroke.
Width : Sets the width of the border stroke. The width is from the outer to inter stroke boundary and the stroke is centered about the border of the graphic.
Dash Pattern : Sets the pattern of the dash. Leave this empty (Continuous Line) for a solid stroke, otherwise set this to a sequence of numbers that correspond to the solid and gap intervals of the dash (an even number of numbers). See Simple Draw Attributes for additional information.
Segment Join : Sets the join type. See Simple Draw Attributes for additional information.
End Cap : Sets the end cap type. See Simple Draw Attributes for additional information.
Spatial Metrics
Rotation Angle : Rotates the graphic. The rotation angle is relative to the x > 0, y = 0 line and positive angles are counterclockwise. The dial control is described in the Dial section.
Flip : Flips the graphic relative to the vertical or horizontal center line of the graphic.
Left Edge, Width, Bottom Edge, Height : Sets the left edge, width, bottom edge and height respectively of the reference bounds of the graphic. The bottom and y-minimum are the same (the y-coordinate is never flipped).
The units of the reference bounds are in the coordinate space of the graphic. If the graphic is not on a graph then the units are in the report units of the Graphic View. If the graphic is on a Graph then the reference units are that of the graph itself. The unit designations (symbols) appear in the label above the reference bound fields. If the graph is unitless (which is often the case) then there is no unit designation.